| Program Evaluation:
The evaluation is a significant step in reviewing the effectiveness of a program that is working to increase student learning about a content area. All aspects of the program are covered and use data to measure the success. The five phases of program evaluation rely on defining the need; reviewing best practices; focus needed; the method for the evaluation; and a planned approach for data collection. Before collecting data, there is necessary planning to determine how it is gathered and stored to produce the intended results finalized. The plan prepares for when analyzing data there is a minimal cleanup of the data and to ensure that the analysis can be complete. From the evaluation questions, I will be able to add “success stories” along with the data. These stories should bring about a level of excitement, and a can-do attitude. To do this, I am using a case study method for the project, which will allow for a combination of quantitative and qualitative data and will best fit the parameters of the report. Case studies are “particularly useful for understanding how different elements fit together and how elements (implementation, context and other factors) have produced the observed impacts.” Using Brinkerhoff’s Success Case Method, I need only collect data that is purposeful, gathering information that could be missed if only looked at averages or central tendencies. Allows for the discovery of emerging success factors: the surveys and interviews may uncover additional, unexpected results. This focus is on systems and leveraging learning resources into continuously improved performance. Outputs include relatable stories you can share. Although there are the standard caveats associated with surveys (potential biases and halo effects), these can be mitigated through the step of collecting corroborating evidence. I think that the focus on successes and case stories is striking because it provides a way to involve stakeholders in a meaningful dialog about continued process improvement. After analyzing the data, the evaluation will communicate findings, share what successes have occurred and what organizational resources have supported these successes. As important, sharing examples of non-successes. Also, what barriers kept people from applying what they learned? Here you will find the executive summary report.
|
 Computer Science Grant Summary 2016-2017
|
BackgroundThe Washington State Office of Superintendent of Public Instruction (OPSI) is committed to the successful implementation of rigorous computer science K-12 learning standards, ensuring the statewide advancement of Governor Jay Inslee’s vision for computer science education utilizing cross-agency cooperation to fulfill local industry growth. The U.S. Bureau of Labor Statistics predicts that by 2024, there will be more than 800,000 new jobs in science, technology, engineering, and math (STEM) fields. Two-thirds of those jobs will be in computing occupations (Hutchinson & Inslee, 2016). |
| Washington State has prioritized computer science as a critical academic subject by adopting computer science K-12 learning standards and by allowing computer science courses to count towards a core high school graduation credit in math or science. Gov. Inslee’s goal is to reach at least 50 percent of Washington students in the next two years (Stang, 2016). To give every student a chance to participate in computer science education, we strive to understand the unique challenges our individual communities face in computer science education. Additional strategies for embedding computer science in basic education and integrating it into core subjects to provide a real-world context for learning and mastering computer science outcomes are integral to implementation. |
 There is a need to help all students explore computing careers, “especially girls, African American and Latino students, as well as students from low-income families to start journeys toward those careers while still in high school” (Chang, 2017, p. 1). The equity gap in computer science education is disturbing. Of the Advanced Placement Computer Science exams given, women accounted for only 22 percent. Additionally, underrepresented students of color accounted for only 13 percent. At the post-secondary level, women earned only 17 percent of bachelor’s degrees in computer science in 2013, and underrepresented students of color earned 17 percent (Golod, 2016). There is a need to help all students explore computing careers, “especially girls, African American and Latino students, as well as students from low-income families to start journeys toward those careers while still in high school” (Chang, 2017, p. 1). The equity gap in computer science education is disturbing. Of the Advanced Placement Computer Science exams given, women accounted for only 22 percent. Additionally, underrepresented students of color accounted for only 13 percent. At the post-secondary level, women earned only 17 percent of bachelor’s degrees in computer science in 2013, and underrepresented students of color earned 17 percent (Golod, 2016). |
ObjectivesThe Washington State Legislature made $2 million in state funding available for computer science and education grants through the Office of Superintendent of Public Instruction (OSPI) in 2015. These competitive grants allowed districts, schools, and nonprofits to train teachers; provide and upgrade technology; and expand access to girls, underrepresented students, and underserved communities. State grant funds had to be matched equally by private sources, which effectively expanded the total grant amount to $4 million (Roscorla, 2016). |
| The development of public-private partnerships necessitated OSPI to dedicate a new position for a Computer Science Program Specialist and coordinate with Washington STEM (WA-STEM) to marshal private champions to help define the value of computer science education to the public. The partnership includes other content areas at OSPI such as educational technology, science, math, and career and technical education, as well as the public partners receiving the service, the press, and relevant interest groups. Communicating openly and candidly with these stakeholders will minimize potential misunderstandings in addition to positive outcomes of the program. |
| For the 2016–17 school year, OSPI is working with WA-STEM and additional partners to identify short- and long-term needs of districts to bring together best practices in integrating computer science into the classroom. The implementation of computer science standards, part of a four- to five-year process, will continue to promote and grow opportunities for computer science teacher training, industry engagement, community awareness, and increasing student enrollment to be more representative of the state’s racial, gender, and socioeconomic demographics. |
Reporting ProcessA structured self-report questionnaire collected information on activities, matching grant agencies, standards focus, and data on student and teacher impacts. The questionnaire also explored events or situations related to individual grant proposal topics and experiences. The section on sample activities provides highlights of select grant participants’ current progress. |
StandardsFor the purpose of this grant, OSPI used the 2011 Computer Science Teacher Association (CSTA) Learning Standards. These standards updated in December 2016 with the adoption of Washington State Computer Science K-12 Learning Standards. The progress report requested information about how grant participants connected grant activities to other Washington State Learning Standards if applicable. |
| The majority of the standards used in the grant participants’ work were the Next Generation Science Standards (NGSS) and Washington State Learning Standards for Math. Links to the NGSS standards were primarily through engineering practices, whereas the math standards aligned with the computer science elementary curriculum used and with Algebra 1, Geometry, and Mathematical Practices. Other standards used were for educational technology, International Society for Technology Education (ISTE), English Language Arts, Social Studies, and Visual Arts. |
| Portions of the Washington State Computer Science K-12 Learning Standards and ISTE Standards have built in opportunities to support K-5 classroom instruction in English language arts (ELA), math, and other subjects. Curricula from computer science organizations, such as Code.org and Bootstrap, have been aligned to the new Washington State Computer Science K-12 Learning Standards as well as the Washington State K-12 Learning Standards for Mathematics and Mathematical Practice.
Several grant participants used the Arkansas Instructional Design Framework as standards and International Baccalaureate standards. The progress report’s standards used outlined an assortment of standards, supporting the need to introduce the Computer Science K-12 Learning Standards to schools and teachers to help with understanding and implementation strategies. |
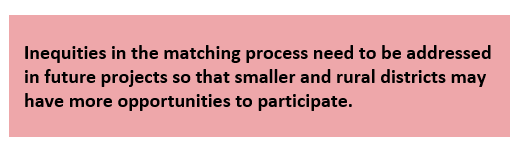
Grant Matching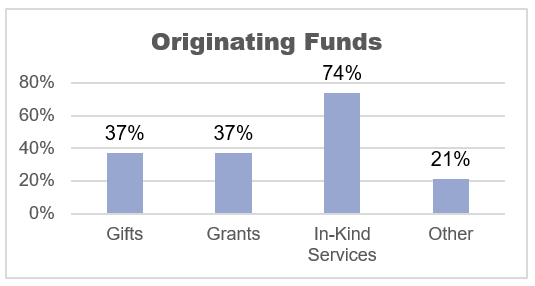 The requirement of finding equally matching funds by private sources proved difficult for several of the 20 award grant participants. Small and rural grant recipients had the greatest difficulties in finding and sustaining matches. One grant participants requested a reduction of their award because they lost 88% of their match; another withdrew when their match fell through.Matches by private sources could include gifts, grants, endowments, and in-kind services; all must be quantifiable. Examples of quantifiable services provided were curriculum, teacher training materials and supplies, Code.org training, Bootstrap materials, and discounts on equipment purchases. |
 |
 Applicants were required to submit letters of support from their match organizations. Most match organizations are local to the grant participants’ communities. The majority of grants, 14 of 19, benefited from in-kind services. Seven grant participants benefited from gifts; an equal number received additional grants. Four grant participants received other types of the match included training, materials, and discounts; see Figure 1. While some grant participants found match organizations difficult to come by, nine of the remaining 19 grant participants found multiple match sources through exceptional outreach and recruiting efforts. Many thanks go to these matching organizations. |
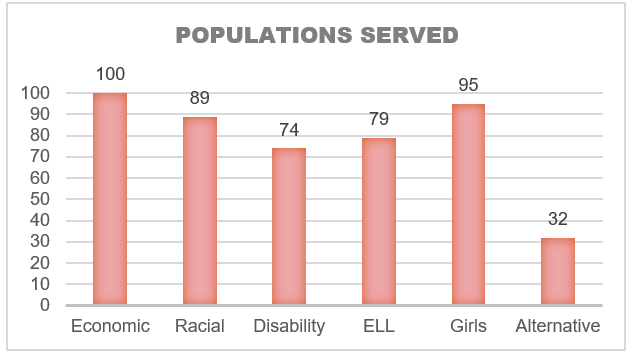
Matching OrganizationsMatching organizations, in alphabetical order, include:Grant PBattelle Corporate Contributions, Bellevue Schools Foundation, Bonneville Environmental Fund, Bootstrap (Brown University), Bootstrap Sponsors (NSF and LinkedIn), Brain Pop, Century Link, Clark Public Utilities, College Spark, Dart Foundation, Digital Dream Labs, Filament Games, Game Salad, Gordon and Betty Moore Foundation, Hagan Foundation, Highline Public Schools, Kelly Imagining, Lego/First Washington, Mid-Columbia STEM Education Collaboratory, Nespelem Valley Electric, Nlight Photonics, OSPI, R & D Consulting, Samsung, Solar 4R Schools, Seattle Public Schools Partnership, SEH America (silicon wafer manufacturing), Sphero, and SWWA STEM Network. Matching funds were also provided by Victor Kores from Intel and other volunteers from various industries.The grant emphasized engaging underserved students with support to the following populations:
|
| Most participants are reaching the targeted groups. Some are struggling to engage students due to teacher/staff inability to offer the tech-centric material. The least served student population has been students in alternative education: only 32% of the grant participants have addressed the needs of this population. However, several grant participants are developing a foundation on which to get started. |
ActivitiesSeveral of the grant participants focused on training staff and faculty to offer a specific program. Most have focused on integrating computer science into current courses, e.g., algebra, math, STEM, and others. Some have made an effort to reach out through multiple disciplines. Most grant participants have had some success implementing their project goals. Descriptions of four school districts, Nespelem, Auburn, Tumwater, and Bellevue, are representative of what is taking place across the project including their successes, challenges, and progress in implementation. |
Nespelem School District.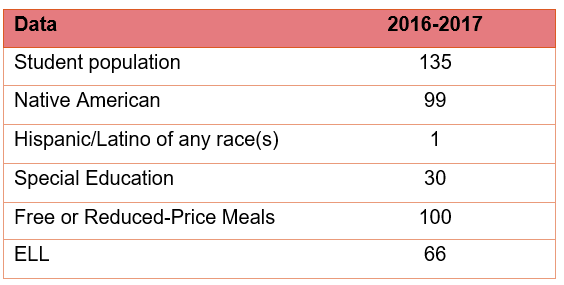 Students in Nespelem School District, grades PreK-8 grades PreK-8 (see Table 2 for the number of students and percent of student populations served in Nespelem School District), and their teachers are integrating computer science skills so all students can create, connect, communicate, collaborate, research and demonstrate creative thinking and construction of knowledge with innovative artifacts. Computer science standards are being integrated into math and science curriculum creating real-world project-based learning activities. Students have created storytelling in their ELA classes that creatively solved problems using 3D printers and 3D designing software that helps with understanding math and ELA concepts. The purchased technology allows for more research activities and enhanced responses to interventions. The district is currently developing a replacement hardware cycle and will utilize other grants and savings from general education to sustain current growth. |
Auburn School District.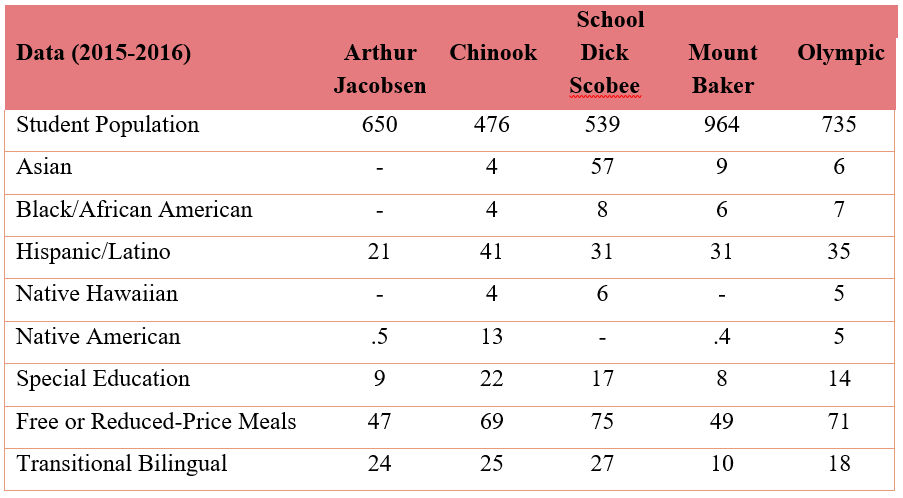 The Auburn School District is creating an advocacy plan to allow staff across all schools to build on and sustain this work. Career and Technical Education and the Technology Department will share costs of supporting teachers in ongoing training. They are currently building support for ongoing programs through school board meetings, winter presentations, principal meetings, and parent meetings, as well as developing a support plan for the implementation of Computer Science Discoveries in the future. Teachers and students in Auburn enjoy and find relevance in computer science education. Offline work is as important as online work. Students with disabilities have multiple onramps to participation in computer science both offline and online, depending on the student. Critical thinking, problem-solving, and creativity are developed through computer science education. They reported that the pace and level of implementation vary greatly by school based on competing priorities and instructor preference. |
| Curriculum using Code.org Computer Science Fundamentals were implemented in four Auburn School District elementary schools; Arthur Jacobsen Elementary, Chinook Elementary, Dick Scobee Elementary, Mount Baker Middle School, and Olympic Middle School (see Table 3 for the number of students and percent of student populations served in Auburn School District) after creating draft curriculum pacing guides and supplemental technology development charts. The district purchased introductory robot kits for each elementary school. At the middle schools, instruction in Code.org IT Fundamentals courses is well underway. Afterschool opportunities in computer science are being offered through Latinos Unidos Club. |
Tumwater School District.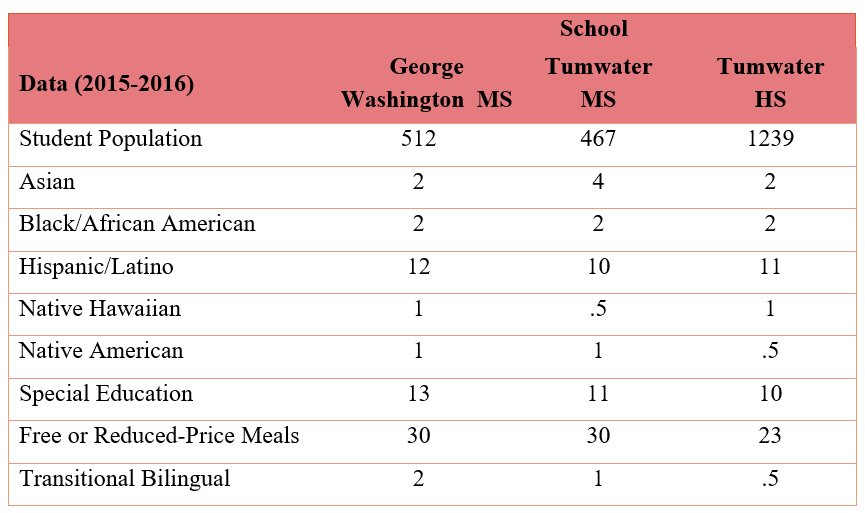 Some Tumwater elementary students are spending additional time during recess and after school working with Bots (Teach Wonder’s Dash & Dot robots and Lego’s Milo the Science Rover), coding, and storytelling. A few of them, with great pride and excitement, presented their month-long coding projects to the Tumwater School Board. Tumwater also observed secondary-level students who had been struggling to connect school and purpose, are now finding meaning and 21st-century skills in school. A shift is occurring in Tumwater as teachers become facilitators and guides rather than “holders of knowledge.” Tumwater is using their grant funds to train staff in Introductory Computer Science and Computer Science Principles curriculums, as well as expanding the technology to VEX Robotics and increasing robotics opportunities for the middle and elementary school. Working with ELA, science, and CTE/STEM, they are creating a K-12 program that will produce work-ready students. |
| The Tumwater School District is developing programs that have access points for all kids (see Table 4 for the number of students and percent of student populations served in Tumwater School District). By strategically pairing students with disabilities with advanced placement or honors students, they have found that the students become more resilient and can persist through. |
Bellevue-Seattle Partnership.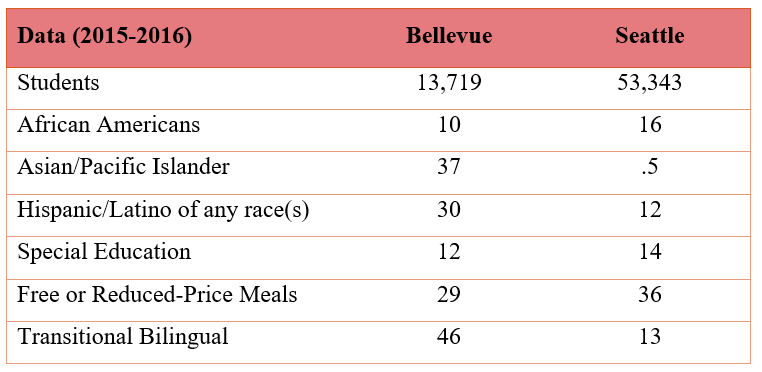 The Bellevue School District, in partnership with Seattle Schools (see Table 5 for the number of students and percent of student populations served in the Bellevue-Seattle Partnership), has developed an online and in-person delivery of teacher professional development for integrating Computer Science Teacher Association (CSTA) K-12 Computer Science Standards. They have also developed K-8 computer science integrated curricular resources in math, science, visual arts, and social studies that were developed and published on an open-source online platform. Through their partnership, they have created a community of practice to support equitable access to computer science education. |
| Several quality open-source computer science materials are being developed, and participating teachers reported a high level of engagement and satisfaction with their involvement and the quality of resources in the pilot. This Bellevue-Seattle partnership represents a significant step towards closing the opportunity gap that has existed in computer science education.
The open-source nature of resources created with the grant funds will allow for scaling of the project within the partnership as well as to other districts. Teachers in Bellevue and Seattle have developed a community of practice through this work, shifting the culture towards one of equity-based computer science instruction, which will support sustainability. The Bellevue-Seattle partnership is actively pursuing additional grant funds that will complement and build upon the work begun under the existing OSPI grant. |
DataEvaluating how many students were previously exposed to computer science before the grant funds were released in January of 2016 is difficult. Also, there are multiple areas that have been addressed through the grants. Data that we have is a baseline of the number of teachers and students in the state and in the areas that have had active support are in CTE, Code.org, and Advanced Placement/International Baccalaureate (AP/IB). |
State DataGrant participants have reported the number of teachers and students who were impacted/served through the grant. While this data is only for the 2016-2017 grant year as of January 30, 2017, there are expected impacts on additional teachers and students through scalability and sustainability. For reference, the total number of students (1,086,000) and teachers (71,761) statewide is the baseline to begin to evaluate the exposure to computer science. |
CTE Enrollment DataClasses that are offered through CTE are tracked through a course code (CIP Code). All computer science classes are coded: middle school classes are coded 110701, high school classes are coded 110201, and all fundamentals courses are coded 110103. The number of students enrolled in these CTE classes is listed in Table 6. All high school AP courses are coded under 110201. The numbers for 2016-2017 are not available at this time.
|
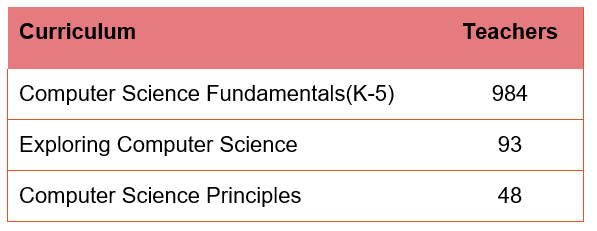
Code.orgThere are nine Educational Service Districts (ESDs) in Washington State. Two ESDs are regional partners with Code.org: Northeast Washington Educational Service District 101 and Puget Sound Educational Service District 121. Together they have trained 14 facilitators that have provided professional learning for the districts opting to use Code.org curriculum. Through these facilitators, Code.org has trained 984 teachers in the use of the Computer Science Fundamentals Curriculum, 93 teachers in Exploring Computer Science and 48 teachers in Computer Science Principals.
|
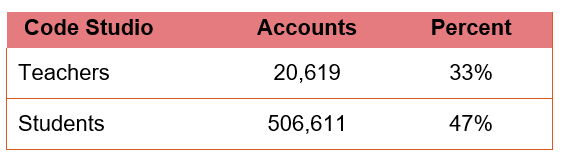
Code StudioCode Studio is an interface for teachers to monitor where their students are in lessons that teach the basic concepts in programming using block language. Code.org reports that there are 20,619 teacher accounts and 506,611 student accounts in Code Studio in Washington State (Code.org). The news is promising as up to 33% of all teachers, and 47% of all students have had some exposure to computer science. Code.org provides curriculum for Computer Science Integration; computer science in algebra courses and computer science in science courses (Project Guts). It would be beneficial to know how many schools are using this curriculum and then understand how students and teachers are having the most success.
|
AP/IBThe AP/IB course and other introductory computer science classes offered at the middle and high schools, as well as integration into math and science at the K-8 level. The data available is related to AP/IB courses and AP STEM courses in Washington State high schools. The data is evaluated using the number of districts, high schools, and students who have completed either an AP/IB computer science or AP/IB STEM course (student and course data provided by Washington’s Education Research and Data Center (ERDC)). 
|
Grant Data |
Educational Service Districts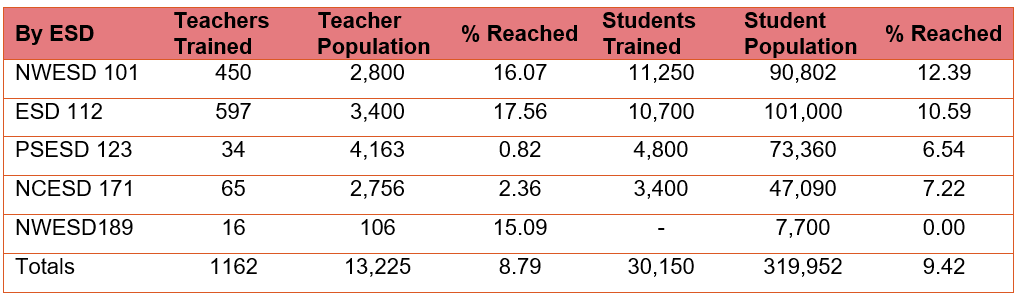 When reviewing the populations served in relation to population totals, the data discrepancies suggest that there were two subgroups to consider. The two subgroups are the ESDs and the district/non-profits. There are overlaps between the ESDs and district populations, although the difference in the values was not of significance for this overview. There are nine regional Education Service Districts (ESDs) in the state of Washington. ESDs were developed to ensure equal educational opportunities for quality education and lifelong learning in all regions. Many activities are supported through the ESD; they also are a liaison between local districts and OSPI to deliver programs mandated by the state. In Table 14, the data shows that the ESD’s were able to access a large number of teachers, through contact with districts they support. |
| They reached approximately nine percent of the teachers in the regional areas, but as the data shows the more effective ESDs were able to reach a significant number of teachers and students. The other data not reflected in the reports is the number of rural schools and districts that they were able to reach. Considering the large geographic areas covered, being able to track communities served would benefit the collection of resulting best practices.
The data reviewed is self-reported. Therefore the reports would have a certain bias in the presentation of the outcomes. Research should be done to create data metrics for future grants reports. Student and teacher data is already collected through OSPI and there may be opportunities to create computer science skill assessments; either way, data collection strategies must be improved. |
Districts/Non-profits.
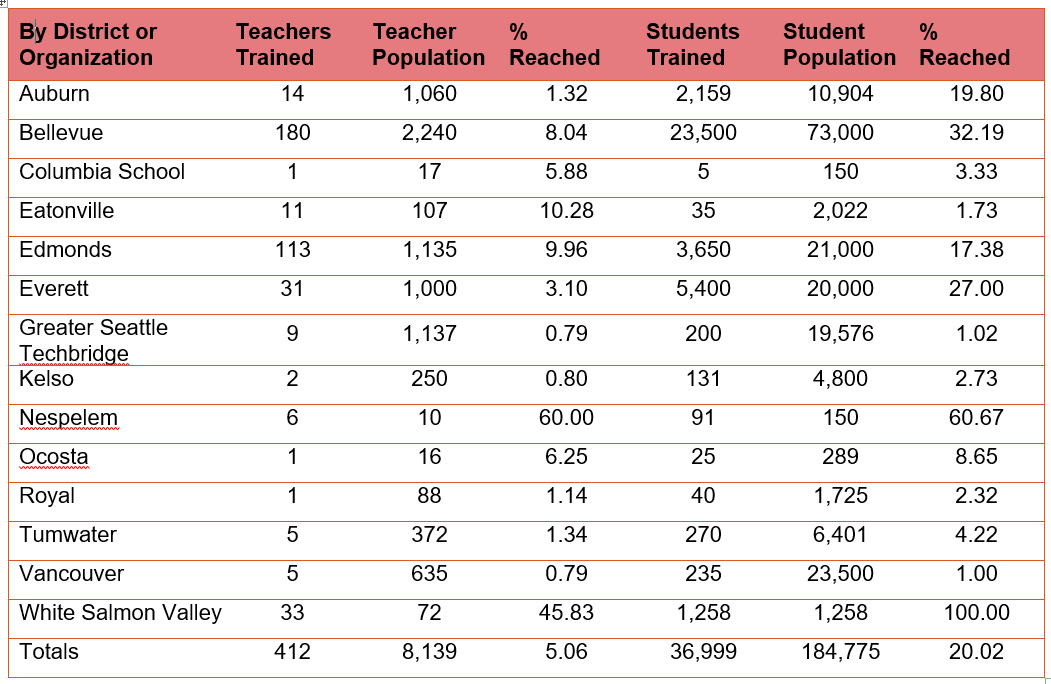 Schools and districts that received the grants were able to impact students directly through the teachers that received training. A majority of the teachers were working classrooms and were provided a just in time learning/training model. Impact varied widely by the amount of the grant and resources available. Five percent of teachers working in the combined schools and districts received training, but those teachers impacted twenty percent of the students enrolled in the combined schools and districts. While the grade level of the students could be broadly discerned through the grade level in the schools, more information would need to be gathered to define whether computer science skills were integrated into math or science curriculum or stand alone classes were created or implemented. Individual school and district data are listed in Table 10. |
Final NotesThe strengths and challenges are from grant participant experiences. Strengths are places to start, and challenges are to inform project design. The recommendations are to improve upon the next grant application process. |
Strengths
Challenges
Recommendations
Future Needs
The outcome of any grant working with schools is about the students and making decisions based on what is best for student learning through a positive learning environment that is supportive and respectful. |
ReferencesBottoms, G., & Sundell, K. (2016). The future of K-12 computer science instruction. The State Education Standard, 16(3), 24–31. Retrieved from http://www.nasbe.org/wp-content/uploads/Future-of-K12-Computer-Science-Instruction_September-2016-Standard.pdf Chang, R. (2017). Report: Five actions states can take to bridge the computer science ed gap. THE Journal: Transforming Education Through Technology. Retrieved from https://thejournal.com/articles/2017/01/17/report-five-actions-states-can-take-to-bridge-the-computer-science-ed-gap.aspx Code.org. (n.d.). Support K-12 Computer Science. Retrieved from Code.org: https://code.org/advocacy/state-facts/WA.pdf Golod, A. (2016). Google: Girls can do great things with code. U.S. News & World Report. Retrieved from https://www.usnews.com/news/stem-solutions/articles/2016-10-18/google-girls-can-achieve-great-things-through-coding Hutchinson, A., & Inslee, J. (2016). A bipartisan appeal for computer science education. U.S. News & World Report. Retrieved from https://www.usnews.com/opinion/knowledge-bank/articles/2016-02-11/arkansas-and-washington-lead-efforts-to-expand-computer-science-education?context=amp No Child Left Behind Act of 2001, P.L. 107-110, 20 U.S.C. § 6319 (2002). Roscorla, T. (2016). Washington State continues to push for computer science education. Center for Digital Education: Converge. Retrieved from http://www.centerdigitaled.com/higher-ed/Washington-State-Continues-to-Push-for-Computer-Science-Education.html Stang, J. (2016, Dec 8). Washington Gov. Inslee pushes for broad adoption of new computer science education standards. GeekWire. Retrieved from http://www.geekwire.com/2016/washington-gov-inslee-pushes-broad-adoption-new-computer-science-education-standards/ |
Practicum

(Visited 262 times, 1 visits today)